Exploring Moduli of Tori: Isotopies and Area Distortion
Here we view different geometric structures on a torus. One aspect of this change is the metric distortion — how much the surface area of small neighborhoods stretches or shrinks during the transformation.
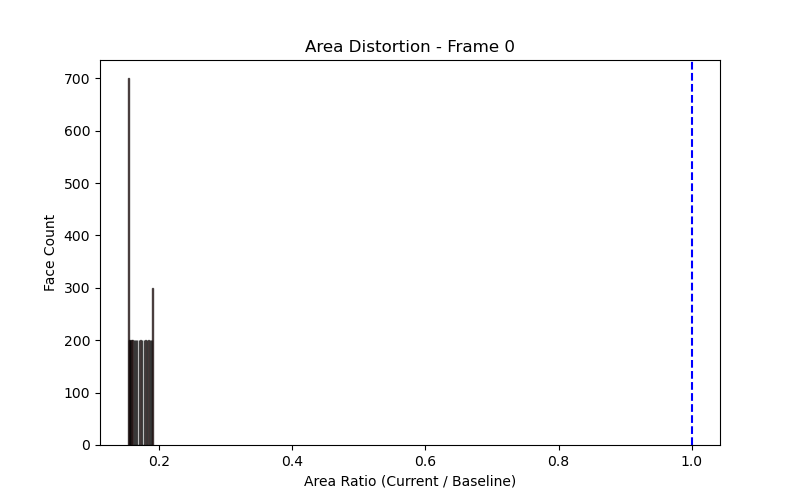
The color mapping uses coolwarm centered at 1.0. This means if a face has the same area as the baseline, it will appear grey/white. If it’s larger, it turns red; if smaller, it turns blue. The histogram on the right quantifies this distortion across all faces, showing the distribution of area change.
Note: The drift of the histogram away from 1.0 quantifies how much the geometry is stretching.
Geometric Distortion
Top: histogram representing the distribution of area change across all faces. An area-preserving map would result in a single spike at 1.0
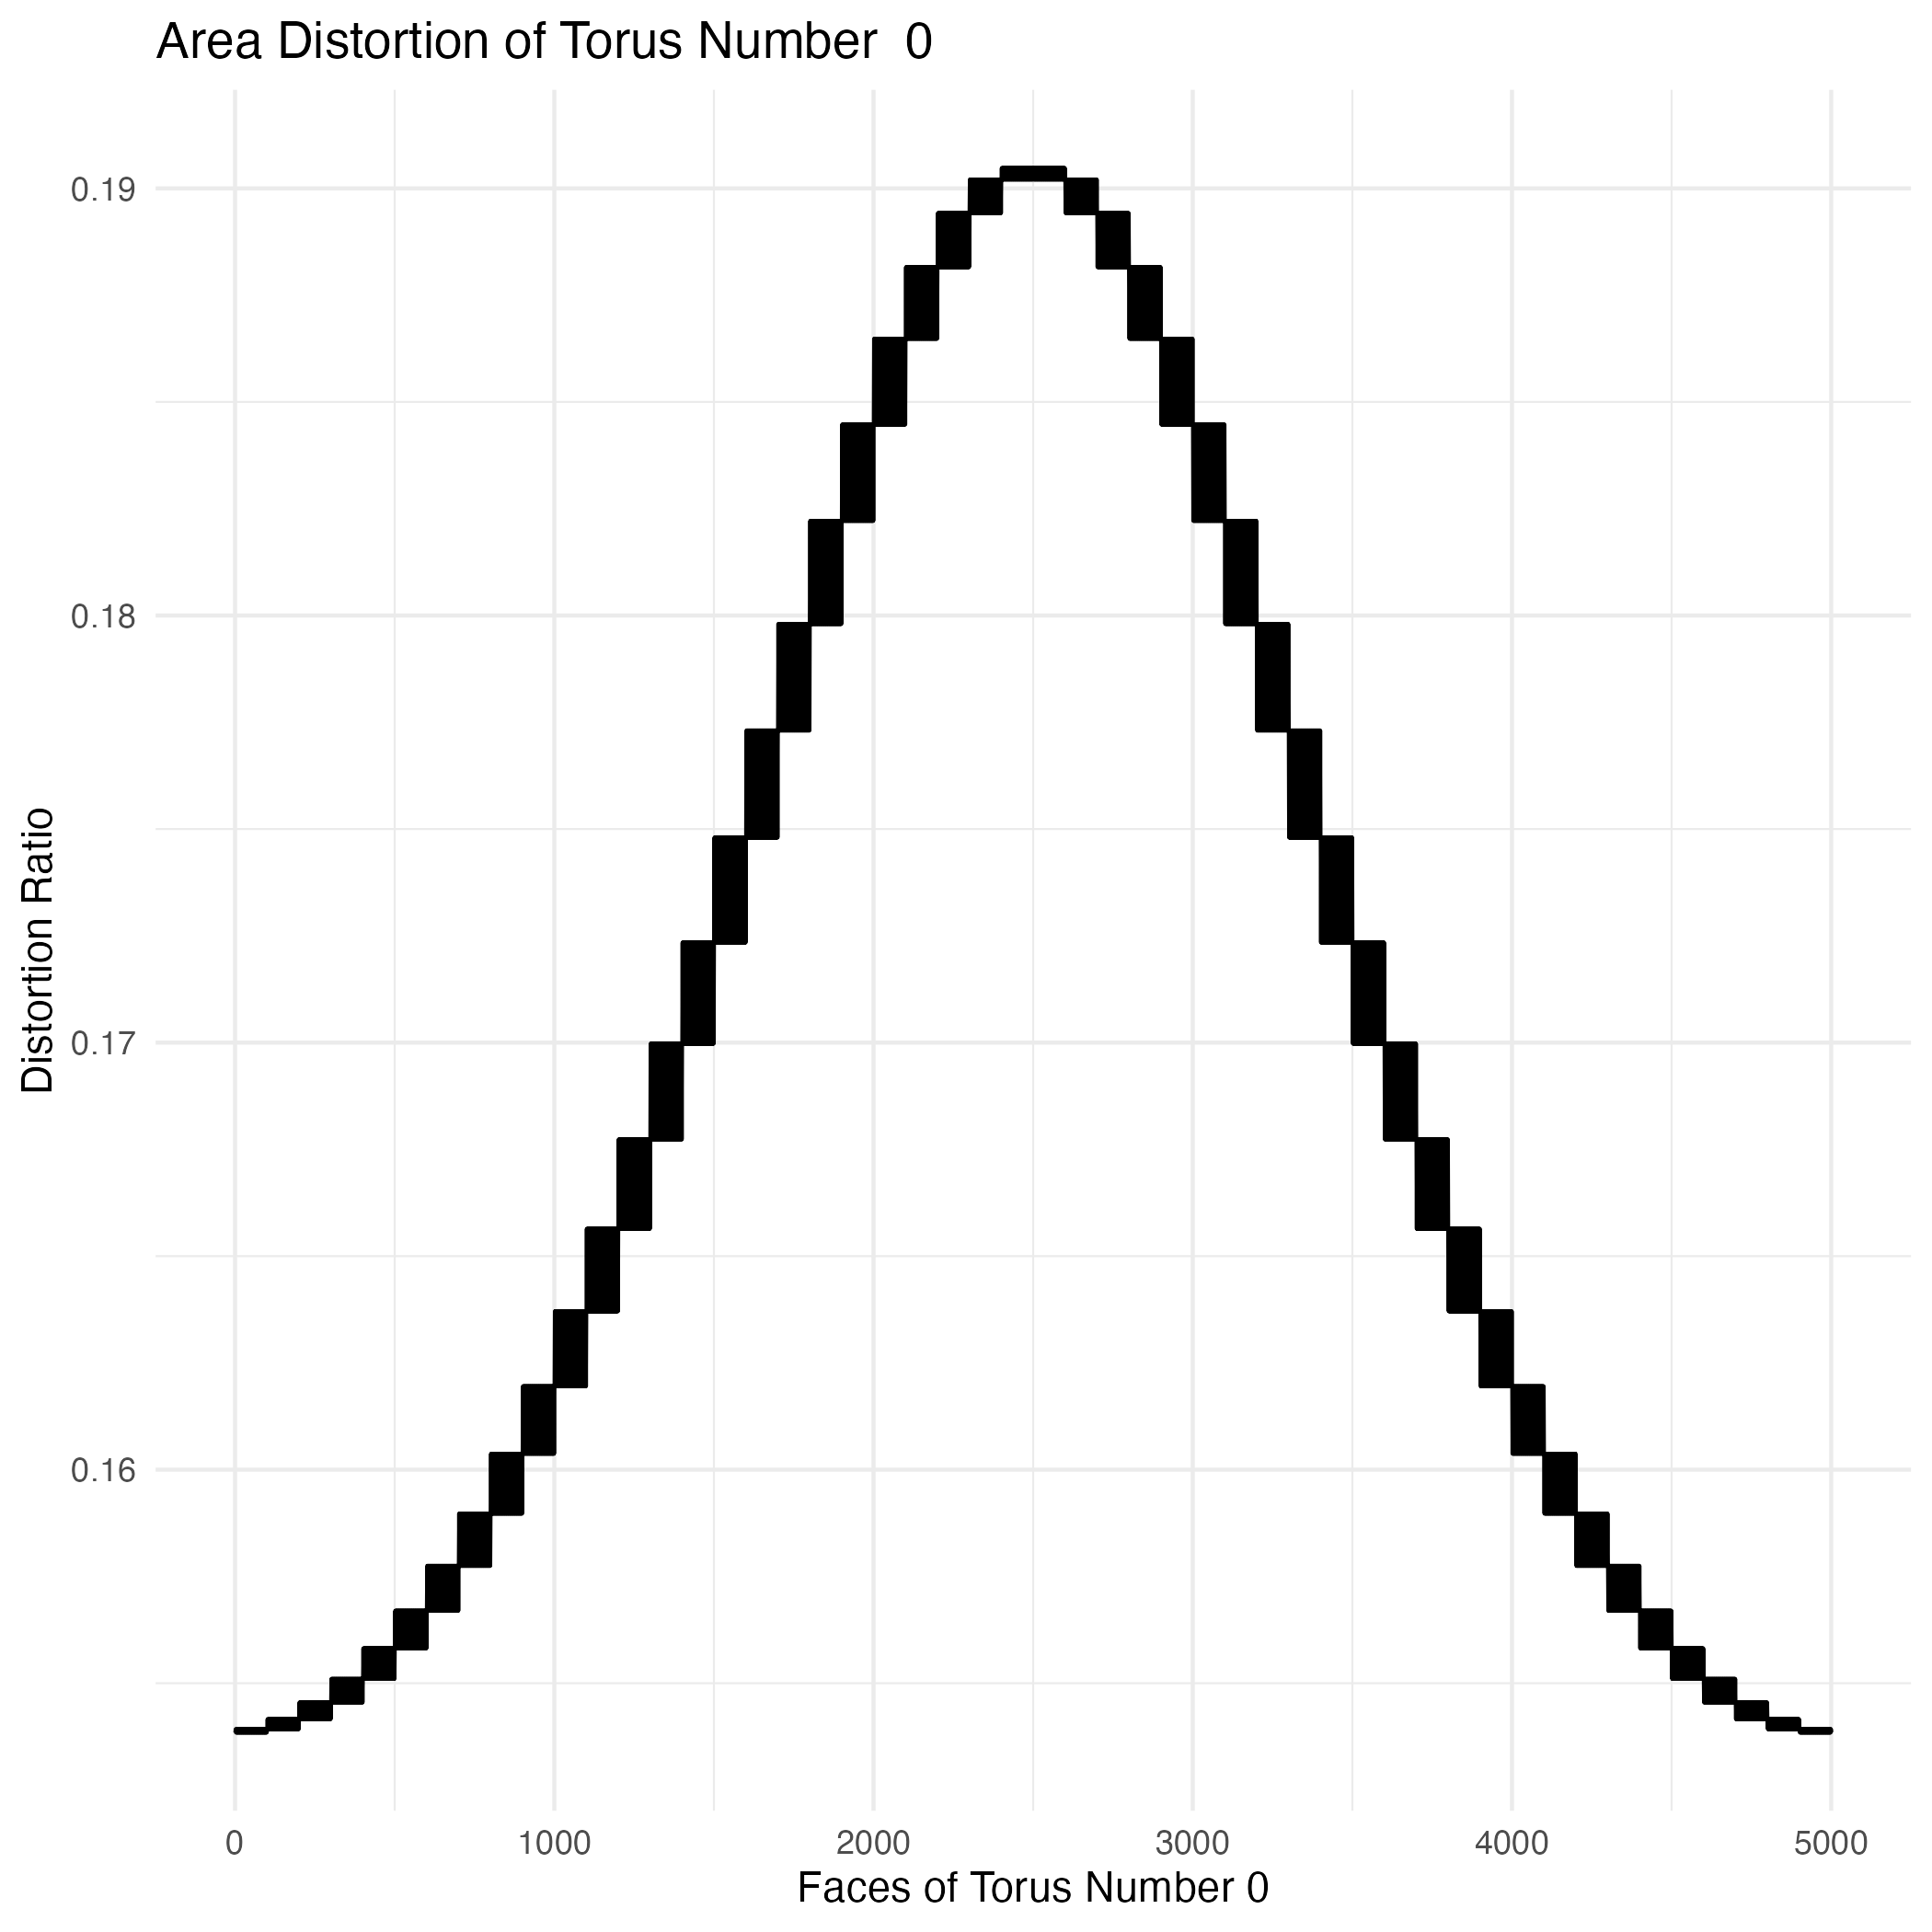
Bottom: distribution of area change across the current surface